· Resource · 3 min read
Basic flow analysis using R
A basic explainer on how to use R to analyze your flow cytometry data.
Sometimes Flowjo isn’t the best way to analyze your data (I know, gasp…), sometimes it’s not available to you or you simply don’t like it. Don’t worry you can also use R! Here I’ll show how I analyzed some (very basic) flow cytometry data. In this case using R was less work for me because I had a lot of samples and a simple readout.
In this example I’m using flow cytometry to make some basic dose response curve, but you can apply it to anything you like, it’s about the principle. The data here is binding of Influenza HA to a cell line, I diluted the HA to see some sort of curve as you might in a ELISA. But that’s not important, to the analysis!
First, what libraries do you need?
library(flowCore)		# allows for loading of fcs files
library(flowWorkspace)		# useful for gating etc.
library(tidyverse)		# you can't do anything without the tidyverse
library(ggcyto)			# plotting facs plots
library(cowplot)		# prettify your plots
library(ggsci)			# get the nature color scheme!
library(here)			# convenient way to locate your data as a subdirectory of where your R file is
Now let’s load the data!
fs = read.flowSet(path="data",pattern = ".fcs",alter.names = T)Now I have all my (conveniently named) fcs files loaded in ‘fs’ I can start gating and adjusting my gates (this is needed once and a bit annoying). We start by making a gating set ‘gs’, make our first gate and view the result.
gs <- GatingSet(fs)
g.singlets = polygonGate(filterId = "Singlets","FSC.A"=c(3e4,25e4,25e4,2e4),"FSC.H"=c(0e4,12e4,18e4,6e4)) # define gate
ggcyto(gs[[1]],aes(x=FSC.A,y=FSC.H),subset="root")+geom_hex(bins = 200)+geom_gate(g.singlets)+ggcyto_par_set(limits = "instrument") # check gate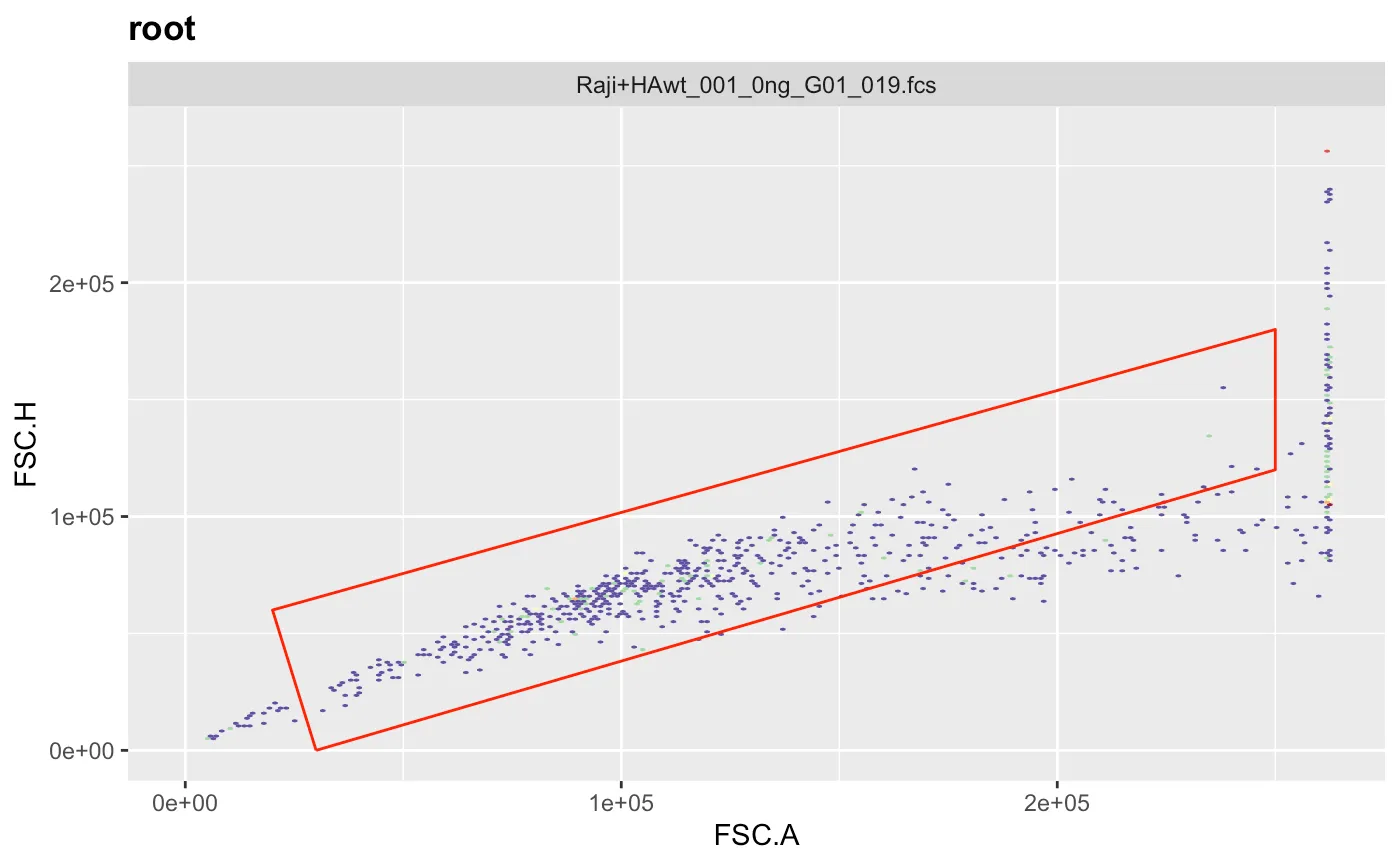 After adjusting the coordinates to our liking we can add the gate to the gating set and recalculate it.
gs_pop_add(gs,g.singlets) # add gate to GatingSet
recompute(gs) # recompute GatingSet
Next we want to add another gate, so we repeat as before with different parameters and withing the previous gate.
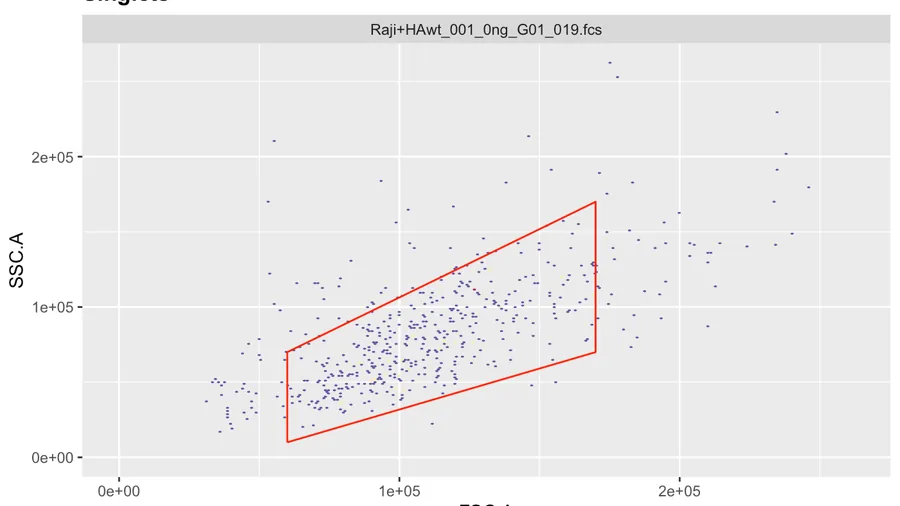
g.live <- polygonGate(filterId = "Live","FSC.A"=c(6e4,17e4,17e4,6e4),"SSC.A"=c(1e4,7e4,17e4,7e4)) # define gate
ggcyto(gs[[1]],aes(x=FSC.A,y=SSC.A),subset="Singlets")+geom_hex(bins = 200)+geom_gate(g.live)+ggcyto_par_set(limits = "instrument") # check gate

gs_pop_add(gs,g.live,parent="Singlets") # add gate to GatingSet
recompute(gs) # recompute GatingSet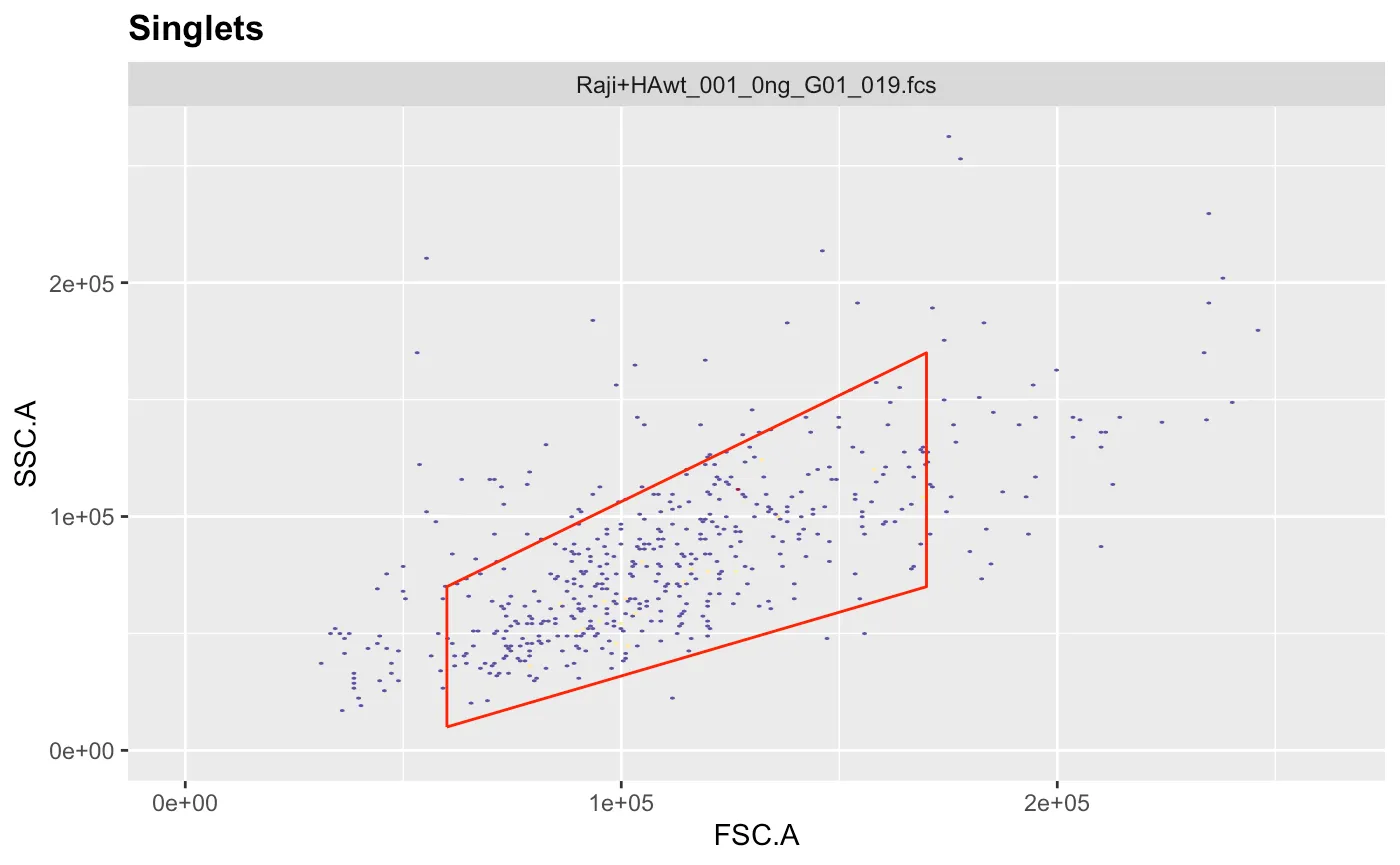
This is the population I’m interested in and I want to know the mean fluorescent intensity (MFI) of the HA (mPlum), but I want to know this for all the different concentrations I used, so let’s get the MFI and categorize our data based on the fcs filename.
df=as_tibble(gs_pop_get_stats(gs, nodes="Live",type = pop.MFI))		# this gets the MFI of all samples and fluophores
df$HAconc = as.numeric(str_extract(df$sample, "[:digit:]+(?=ng)"))	# this makes a column of the HA concentration based on the filename
This results in this table with the MFI and the concentration. 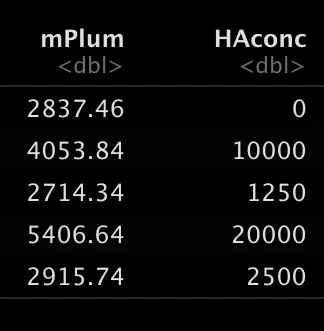
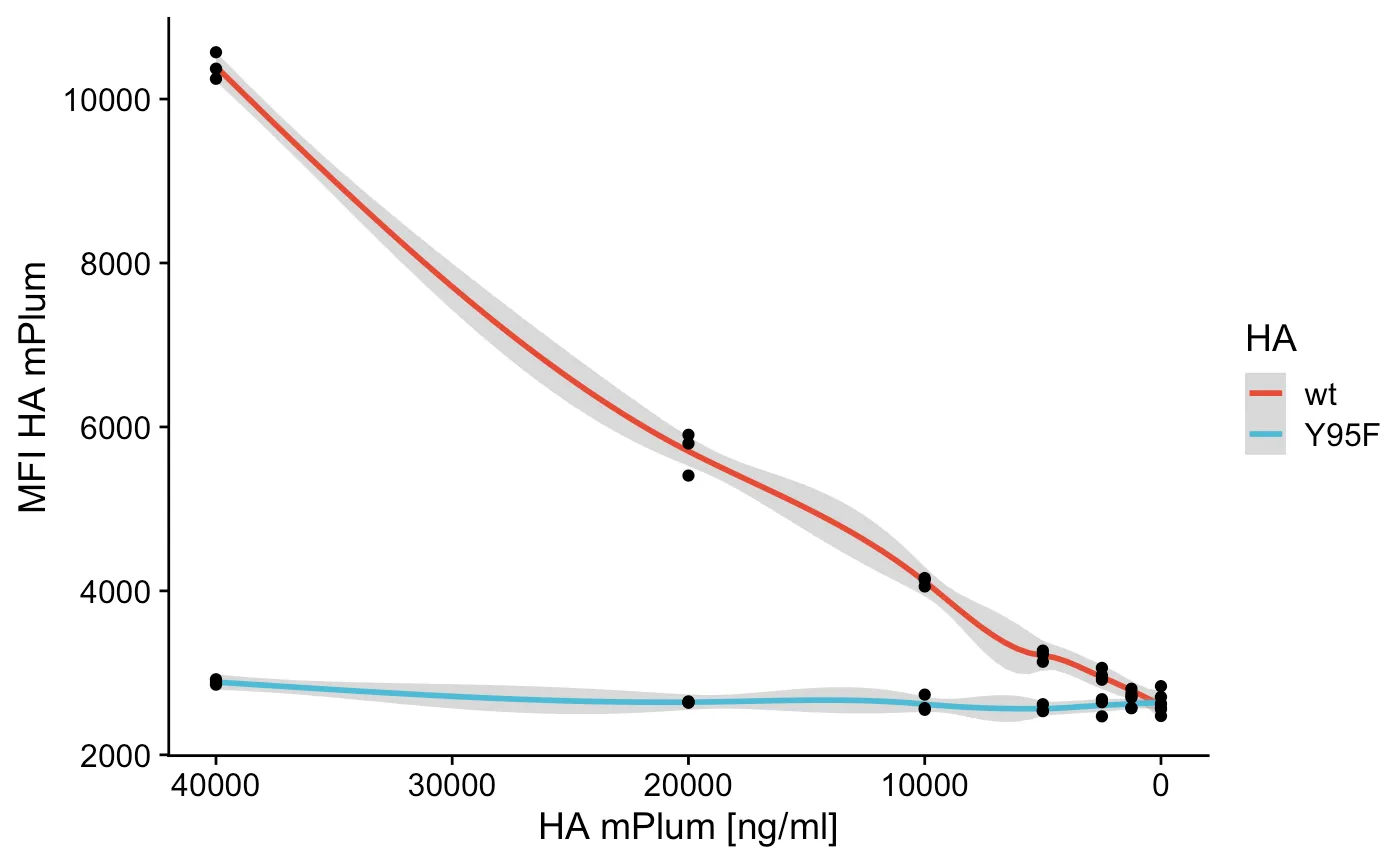
So now I just have to plot the concentration versus the MFI (I did triplicates, which is why there’s a confidence interval).
ggplot(df, aes(x = HAconc, y = mPlum)) +
  geom_smooth(aes(color = HA))+
  scale_x_reverse()+
  scale_color_npg() +
  theme_half_open() +
  labs(x = "HA mPlum [ng/ml]", y = "MFI HA mPlum")
ggsave("HA.pdf")	# save a nice pdf
This results in a nice graph with control, a FACS based ELISA if you will, entirely analyzed in R. Happy coding and flowing!